When we debug programs, we may often encounter entering hardfault. Usually, the cause of entering hardfault may be an illegal operation on the software, such as a stack overflow, an array out of bounds, an unaligned pointer, or an address that is not allowed to operate.
This article will use APM32F407 as an example, without RTOS, to show you how to find the location of the code error when you encounter a hardfault error.
When a hardfault occurs, the code runs to the location below the startup.s file.
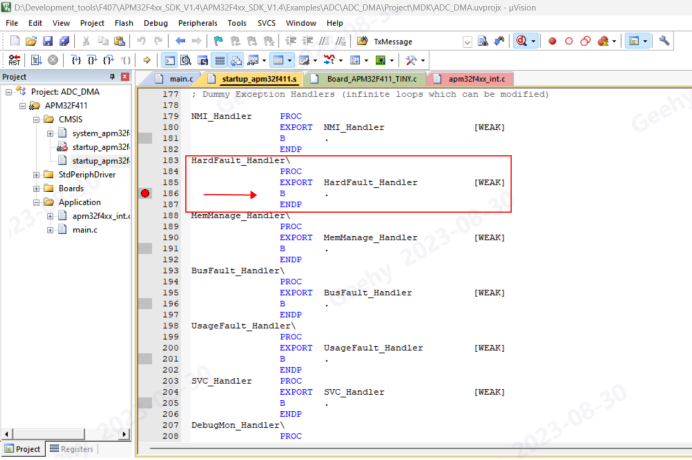
In order to facilitate debugging, we usually add a while(1) loop to the hardfault exception, but you can also add a print program here to facilitate debugging. Set the breakpoint here, the program is running at full speed, and we can clearly see if the code is running at this point.
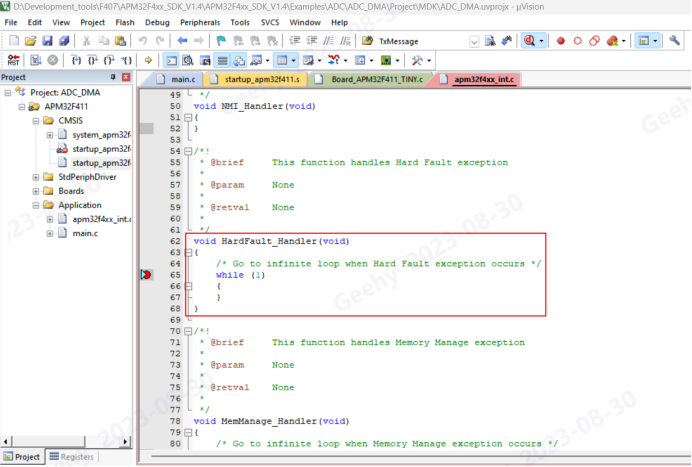
In addition to the above errors, other errors may occur. You can connect to the target chip using Geehylink, enter the debug mode, and open Fault Reports to check the error information.
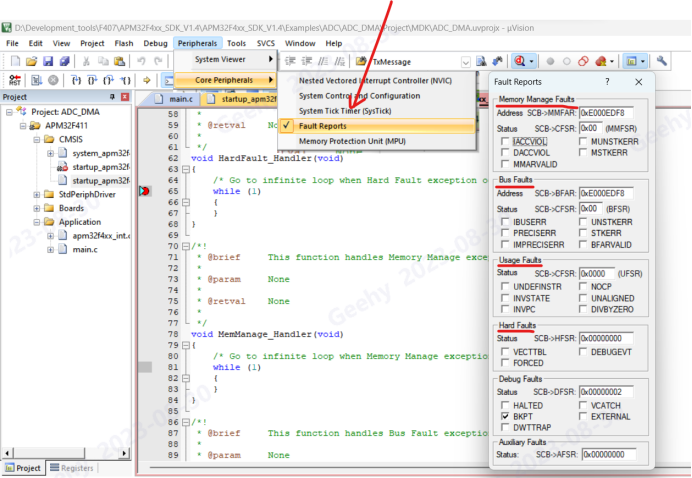
This article focuses on hardfault errors and how to find them.
When a hardfault occurs in the code, the MCU does the following
1) Stack the kernel register with 6 words. The order is xPSR, PC, LR(R14), R12,R3,R2,R1,R0.
2) Select MSP/PSP to update the stack pointer SP
Whether SP is currently using MSP or PSP can be determined by the bit2 bit of the LR(R14) register, if 0, MSP is used, and if 1, PSP is used.
From the stack order and the value of the current SP, we can know the pointer value of the PC before the hardfault occurred. It is equal to SP+4×6(PC pointer after being pressed to stack 6 words).
The value of the PC pointer to the pressed stack can then be used to find out which code was executed before the hardfault exception occurred.
For example: When a hardfault occurs, through the bit2 of the LR register, it can be found that it uses the MSP pointer.
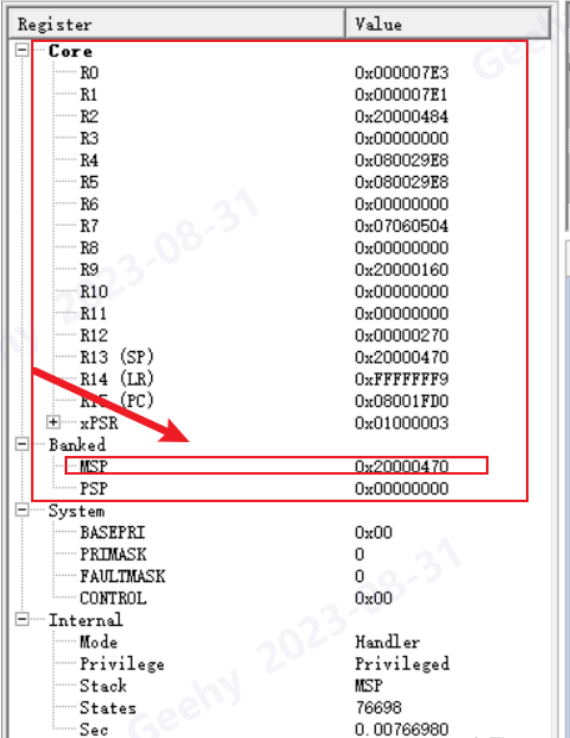
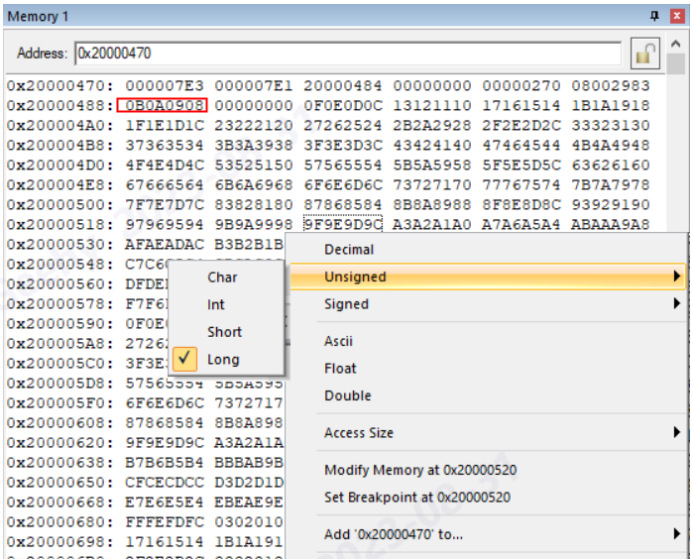
Before hardfault occurs, PC=MSP+4×6=0×20000470+0×18=0×20000488
View the contents of the address in memory
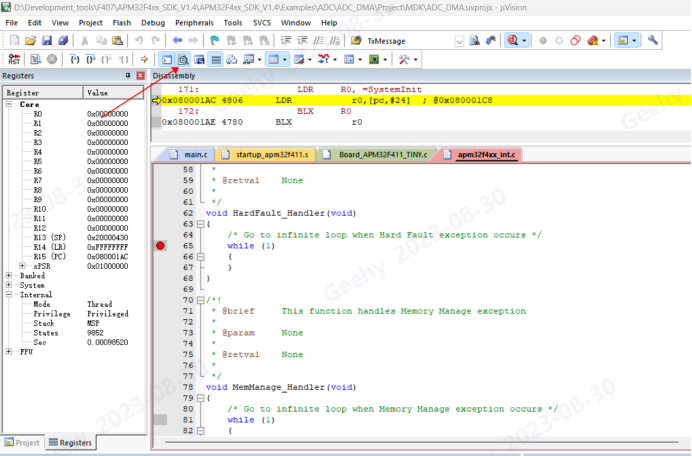
In the IDE tool, open the View assembly feature
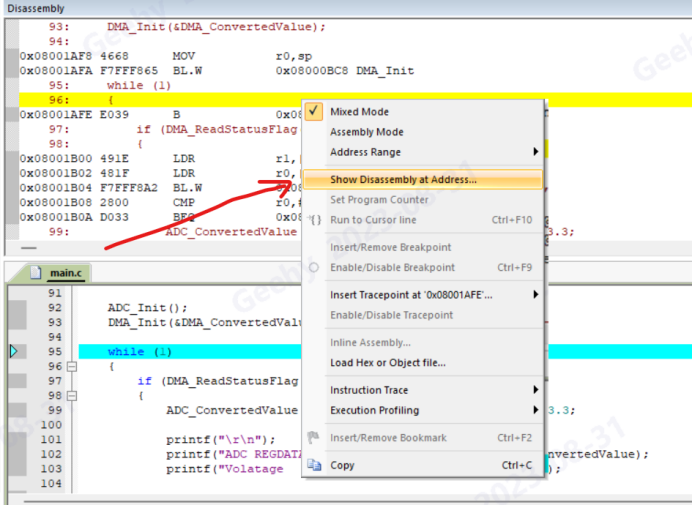
View assembly address
Enter the value of the PC pointer,
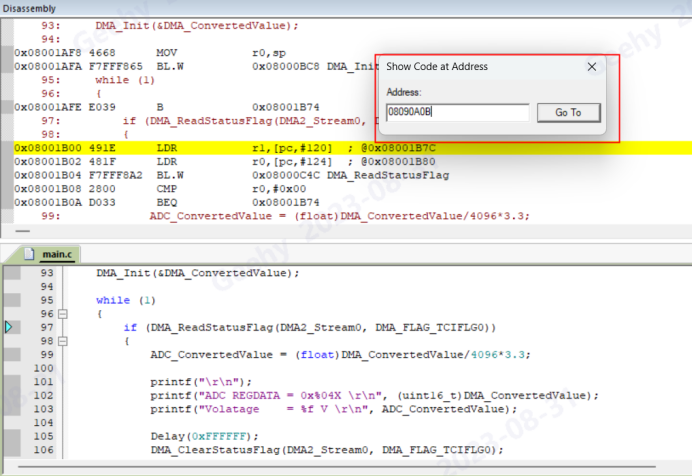
Now, we can directly see the program address that the PC pointer points to.
If you don’t have a source code, bin/hex documentation that finds the issue can also be used to try this. Burn the problem program to the matching hardware and run it at full speed. When an error is found, use the Geehylink debug tool to connect to the target board. You need to be aware of the following in your IDE setup. (Take keil as an example)
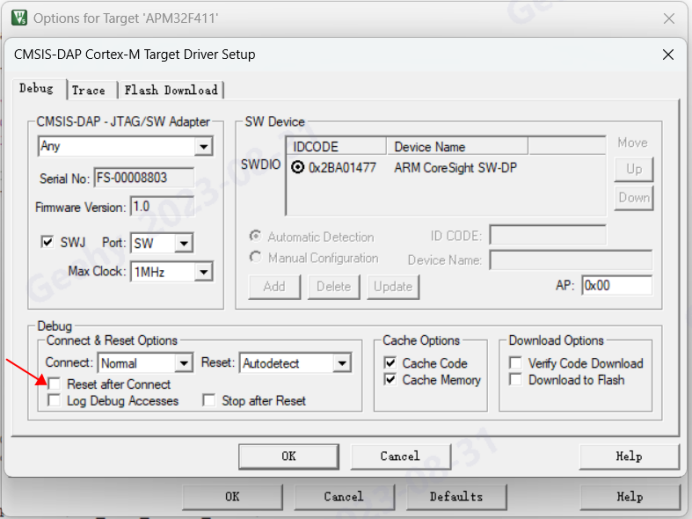
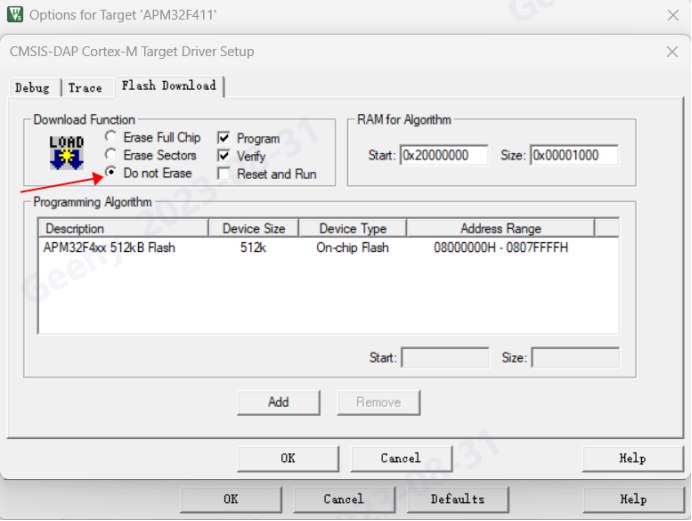
In the same way as above, look at the contents of the relevant registers, you can analyze the location of the code error. The prerequisite is that the debug interface is not occupied by clients; otherwise, the link tool cannot connect to the target chip.
In addition to the above, we also need to pay attention to the investigation of some basic information. For example, a warning message appears when a program is compiled. No warning can affect the program or even cause a hardfault to occur. These basic issues should be eliminated first.
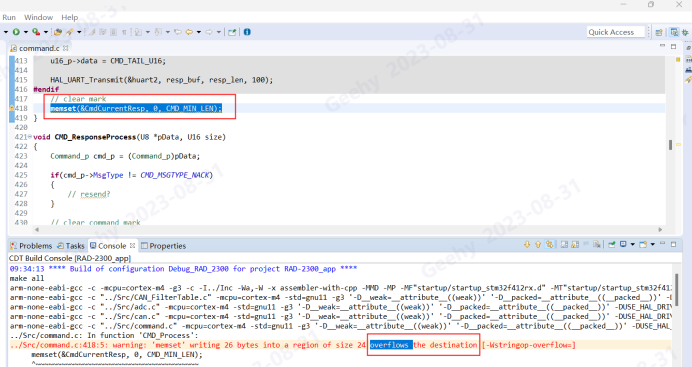
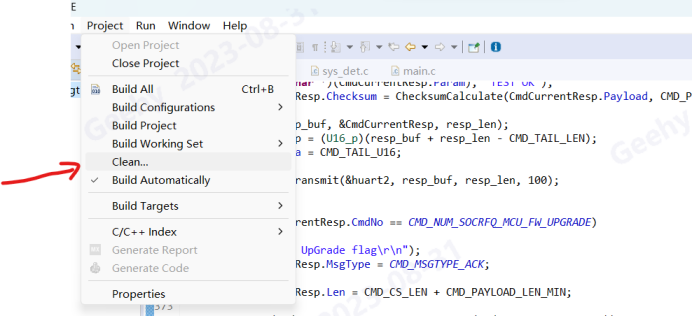
Note that on some IDE tools, the above error message may be displayed only once. The next time you recompile, you may not find the warning message

At this point, you need to clean up frequently to see if your program still has these problems.
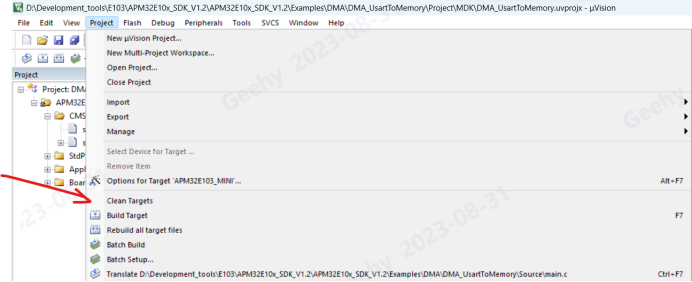
There are many possible factors for hardfault. In addition to the above software reasons, the hardware power supply is unstable, and the MCU core cannot work normally due to virtual welding, which are also many factors that lead to hardfault. Before using the preceding method, check whether hardware is faulty. Otherwise, you may encounter unstable phenomena when you investigate the phenomenon.
With RTOS, the situation is more complicated, which we will cover in another article.